
In a report that unfortunately received a good deal of attention, MSNBC commentator Joe Scarborough asserted that today’s economy under President Trump is in worse shape than the dismal economy under President Carter in 1979. Scarborough pointed to “Jimmy Carter’s so-called year of malaise [1979],” which, said the former Republican congressman, had been “a lot better” than the economy under Donald Trump.
This clip reminded me why I don’t watch MSNBC. Scarborough’s demeanor was overbearing and obnoxious—smug, scornful, dripping with contempt and condescension. It was also spectacularly counterfactual. (Actually, the segment started with some other journalistic-economics malpractice: After playing a video clip of Trump from two-plus years ago saying that he thinks “the economy may ultimately grow at four, five, or six percent,” a female newsreader mocked Trump for having “promised” such growth, when that is clearly not what he said.) This “report” was “gotcha” journalism at its worst. It needs to be corrected before it gains further currency in the press.
The only “evidence” Scarborough cited in support of his outlandish claim was a single datum—a New York Times report that GDP for the fourth quarter of 2019 was only 2.1 percent compared to the 1979 rate of 3.16%. These two data points were presented side by side on the big screen.
Case closed, right? Wrong!
The 3.16% figure is what economists call “nominal GDP.” But economists routinely adjust that figure for lost purchasing power of the dollar to arrive at “real GDP” growth. The reality under Carter was not a healthy, comfortable growth in the economy of 3%. That was an illusion. If you subtract the phantom economic growth attributable to the double-digit inflation that raged in Carter’s last two years in office, you can readily comprehend that the 3.16% figure was phantom, not real, economic growth.
If you look at the following chart found here (which I think understates the economic contraction of the Carter years), you can see that GDP growth was falling sharply during the last two years of Carter’s presidency. By contrast, under Trump real GDP growth is chugging along in modestly positive territory.
I have vivid memories of how tough economic conditions were for me in 1979 as a young teacher near the bottom end of the pay scale. I had received a pay raise of 5.5%. Normally, that would be a raise to celebrate, but with the raging double-digit inflation of 1979 eroding the purchasing power of my dollars by more than twice that amount, my standard of living was falling, not rising. And I was one of the lucky ones; at least I had a job. The unemployment ratewas 6.3% at the end of 1979, and rising.
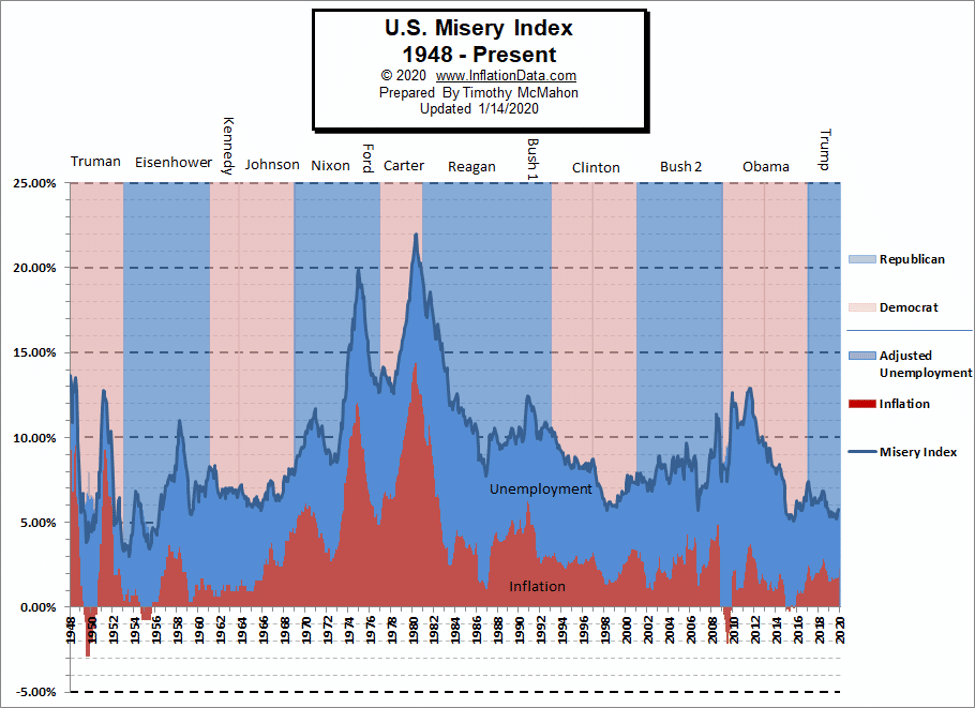
This awful combination of high inflation and high unemployment had given birth to a new term: “stagflation.” Under Keynesian economic orthodoxy, high inflation and high unemployment weren’t supposed to occur concurrently, but they did. So hurtful was the economic impact of these twin plagues that a number called “the misery index” gained wide currency. According to inflationdata.com, “Carter’s misery index peaked at 21.98% in June of 1980. His misery index was still above 20% come November 1980.” That was enough to cause the American people to deny Carter a second term and elect Ronald Reagan in 1980 in a landslide.
Today, people don’t talk about the misery index anymore. It has become a non-issue. At barely above 5%, the misery index is barely one-fourth of what it was under Carter. Here is a chart so that you can see the contrast for yourself:
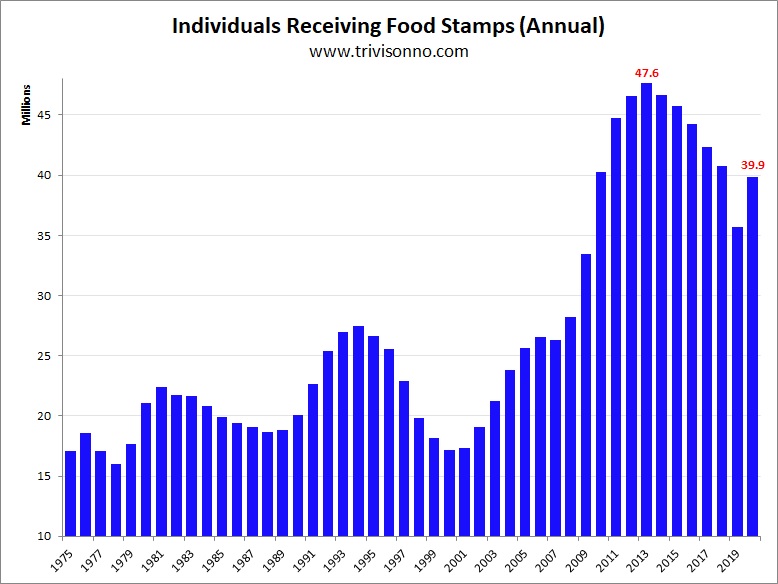
There simply is no factual basis for claiming that the economy is worse today than under Carter. Even The Washington Post—no fan of Donald Trump—has acknowledged that “the typical American worker’s pay is finally growing more than 3 percent a year, a level not seen since before the Great Recession.” And more from the Post: “consumer and business confidence surged after Trump’s election and has remained high, and manufacturing output (and jobs) also saw a noticeable jump in 2018 after Trump’s tax cut…. There’s also been a drop in the number of Americans on food stamps.”
That last datum is worth commenting on. While by no means definitive, changes in the number of people on food stamps serve as a rough indicator of the state of the economy. In tough times, the number of people using food stamps rises; in good times, it falls. As the Post reports, during the Trump presidency, that number is falling (by a whopping 7.7 million, according to official figures). By contrast, during the Carter presidency the number increased dramatically from about 16 million people in 1978–President Carter’s first full calendar year in office–to what the Department of Agriculture states was “a new record high of 22.4 million people” on food stamps in 1981, the year Carter left office.
Shame on Joe Scarborough and MSNBC for their shoddy reporting. They are welcome to report that economic growth is modest and that President Trump is a flamboyantly enthusiastic cheerleader for the U.S. economy who often resorts to hyperbole and exaggeration. But they have no right to butcher the truth with absurd falsehoods such as claiming that the economy today is worse than it was under Jimmy Carter.